Statistics on user actions
In theUsersstatistics section you can evaluate the efficiency of operators' work.
This data shows the operators' speed in the service, as well as the number of actions they perform.
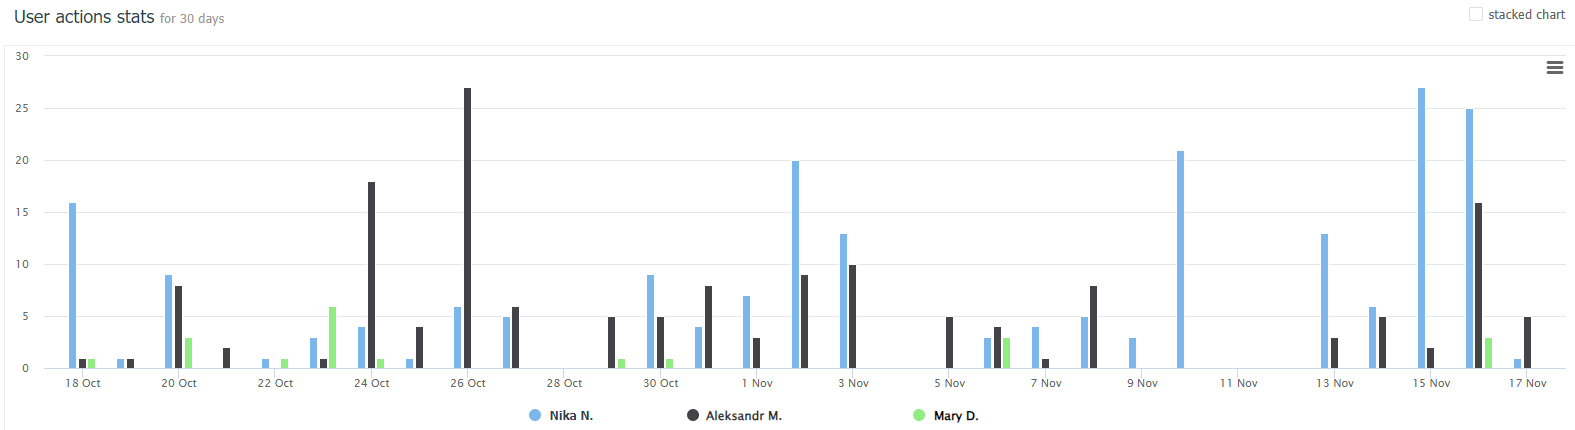
The graph shows the most active users' actions for the selected period (last 30 days by default).
You can choose the type of chart bars display - a regular chart or a chart with accumulation.
In the list you can select which users' actions should be displayed on the chart by checking the corresponding checkboxes.
The chart can be downloaded as an image in various extensions or uploaded as a table.
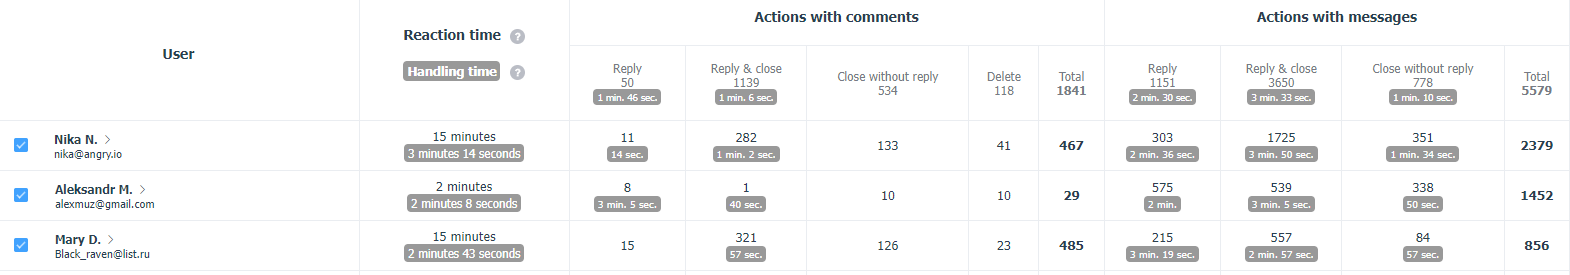
The table details:
- average user reaction time for the selected period
- average user handling time per request for the selected period
- user activity on the service for the selected period
- number of user actions with comments/personal messages for the selected period
- total average handling time for each action
Reaction timeis the time elapsed from the moment a comment/message is published to the moment the user performs one of the actions in the service: Put to work, Reply, Reply and close, Close without reply, Delete.
In the Users section,the arithmetic meanof reaction time for the selected period is calculated.
Also the calculation takes into account the establishedWorking Hours.
For example, you have set up a weekday-only operating hours from 10:00 am to 10:00 pm.
If a comment was written on Friday at 9:00 pm and not responded to until Monday 11:00 am, the reaction time will be 2 hours: 1 hour of work time on Friday (21 to 22) + 1 hour of work time on Monday (10 to 11).
Handling timeis the time elapsed from the moment a user opens a comment/dialog/response window in the service until one of the actions is performed: Reply, Reply and close, Close without reply.
The Users section also calculatesthe arithmetic meanof the handling time for the selected period, similar to the Reaction Time.
If the window was closed by the user without any action, the counter for this request would be reset without entering data into the statistics.
User activityis represented by two parametersTotal hours(total number of hours during the period in which the user performed at least one action in the service) andActions per hour(average number of actions performed by the user in 1 hour during the hours in which the user was active).
Using the table, you can evaluate how efficient your operators are: who sends replies and who simply closes comments, and what time it takes.
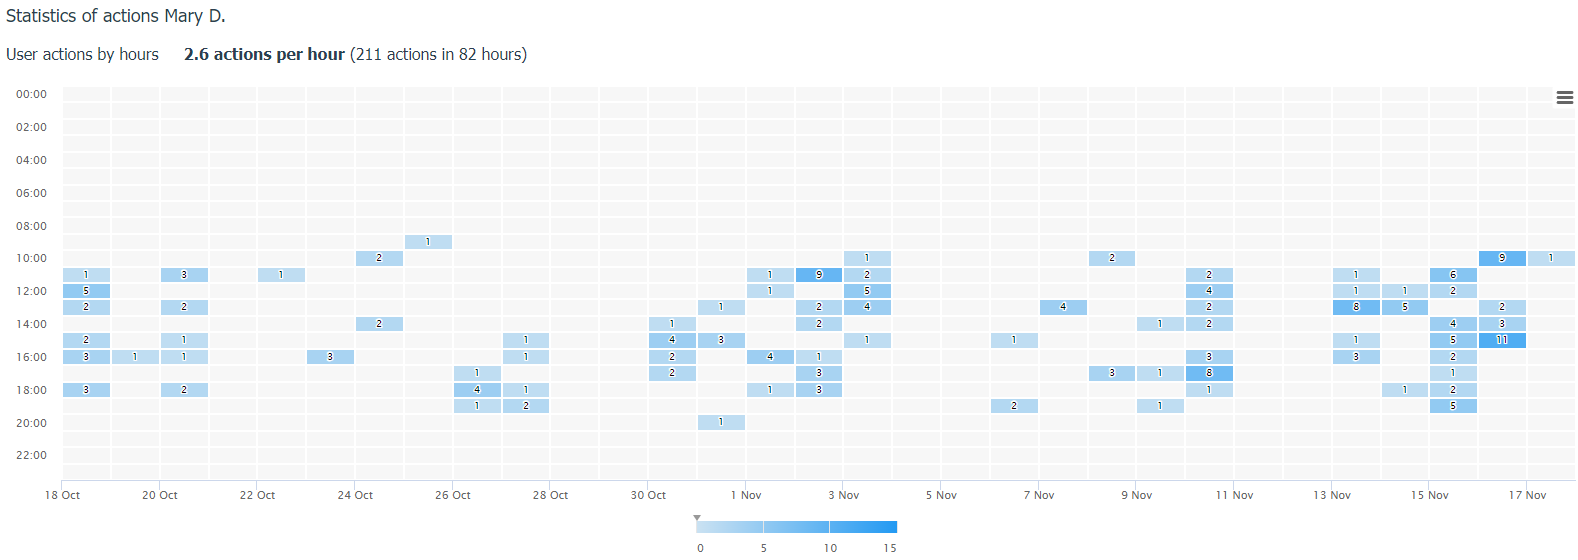
By clicking on a user's name in the table, you can view the statistics of his/her actions in detail.
Using a graph of user actions by hour, you can assess how efficiently an operator works during the workday.
Please note that this graph only appears if you have selected a time period grouped by day.
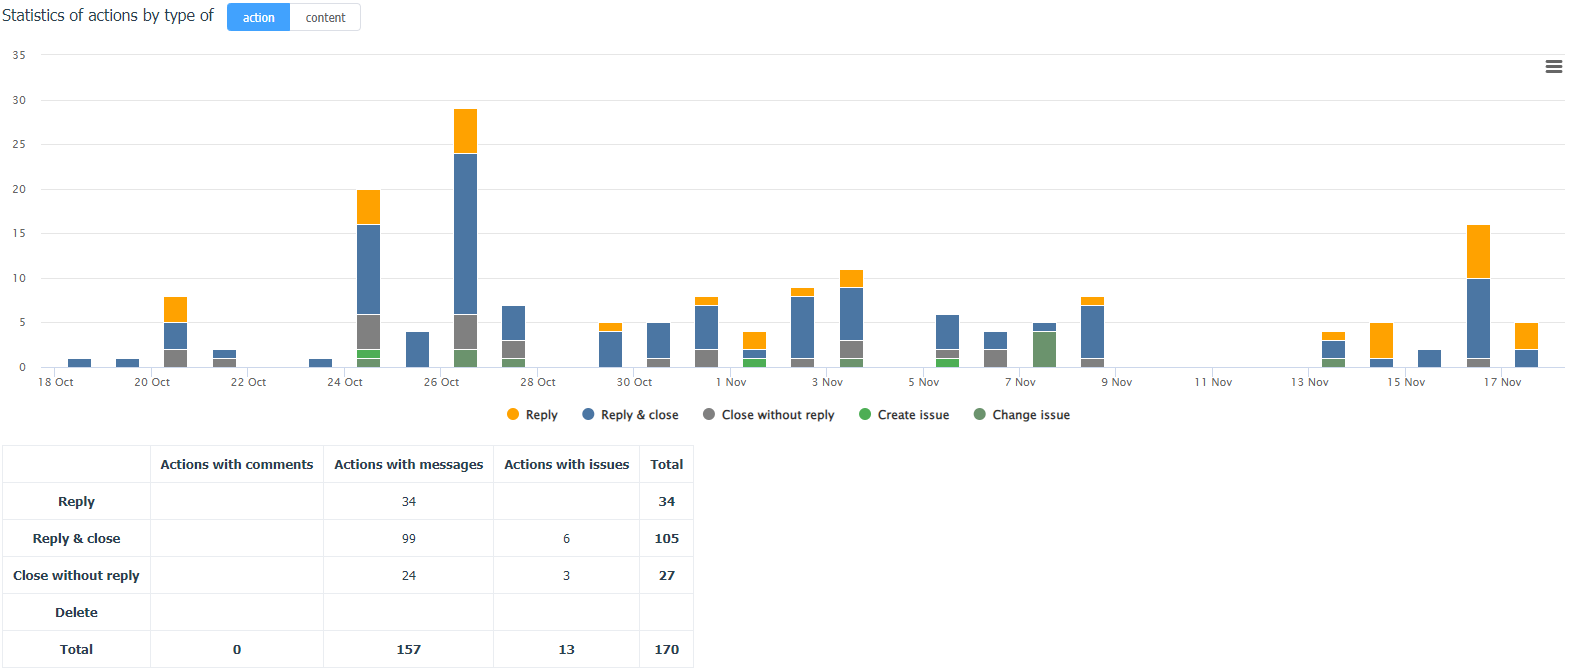
As well as view overall user action statistics by action type (Reply/Reply and Close/Close without reply/Delete) or content handled (Actions with messages/Actions with commens/Actions with issues).
If you want to see more, but also a detailed examination of who responded to what, you can do this in theAction Log.
To analyze the user actions statistics independently, you can export it to CSV.