Statistics on automation rules
If you enable the use ofautomation rulesin the space, the statistics on their operation will be collected in the Statistics - Automation Rules tab.
If you have automation rules that automatically change the status of comments or dialogs to Closed, you'll see a graph at the top: the number of conversations closed by automation rules.
Below is the table with data on automation rules response.
For each rule, the action that is taken with the content when it is activated (tagging, rating sentiment coloring, or closing) and the number of responses are listed as a graph broken down by activity type (comments/mentions and direct messages).
The numbers in the chart are clickable and open a feed of activities in which this rule was triggered.
And if you click on the gear, it will take you to the edit rule page.
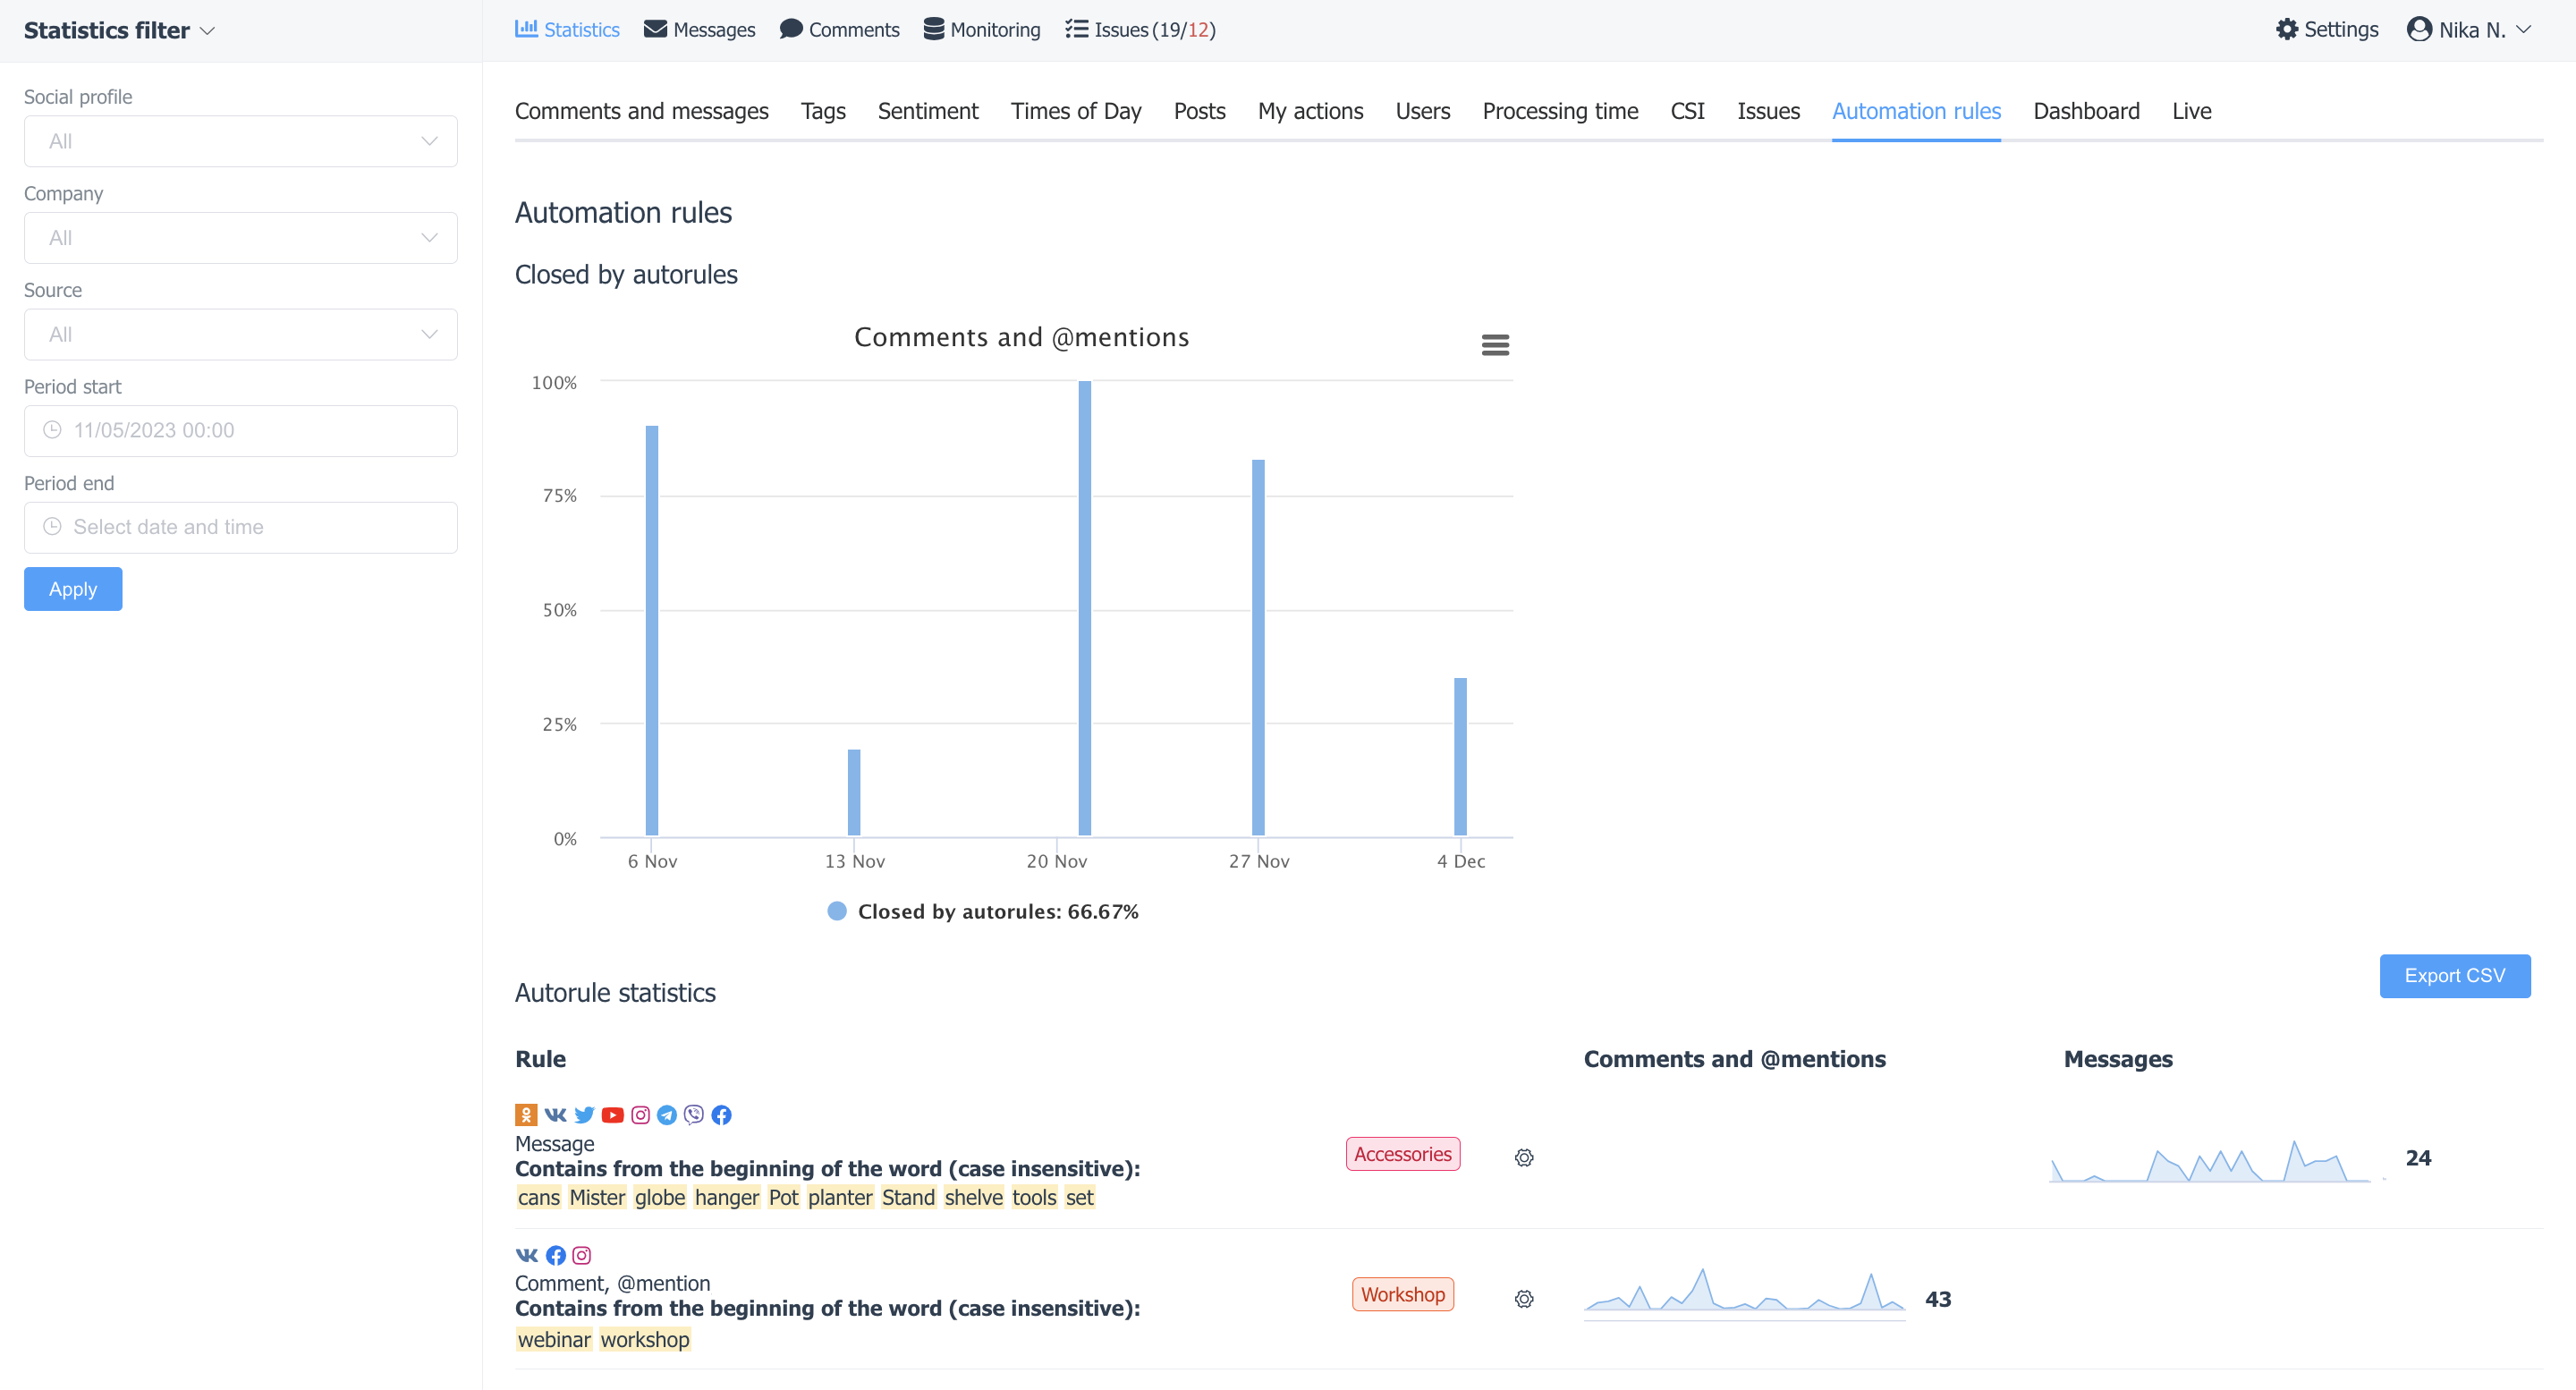
Using this statistic, you will be able to evaluate the effectiveness of automation rules, as well as test their performance.