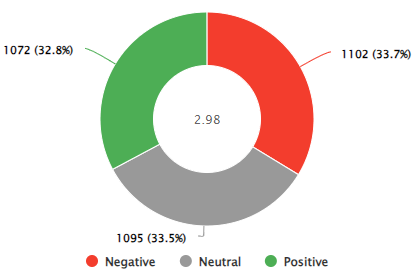
Sentiments statistics
In the Sentiments tab, data on the emotional coloring of content is available, in case operators are marking up when handling comments and direct messages.
The first graph shows the total number of sentiments posted by day.
You can select the period you want to analyze in the filters on the left.

Below is a visualization of the percentage of emotional content.

As well as statistics broken down by activity type.

Further below is a breakdown of all publications with the option to sort (from greater to lesser) by total number of emotional reactions, by number of positive reactions, or by number of negative reactions.

This section of the statistics also presents data on the emotional coloring of activities in the context of tags that were assigned to appeals. This will allow you to track what bottlenecks there are in the operation of your business.
You can sort the data in a similar way to the publication data (see above).

The figures indicating the number of conversions in both the publications block and the tags block are clickable. Clicking on the figure you are interested in will take you to a feed of appeals with appropriate filtering.