For what period can I see the statistics?
By default, statistics are displayed for the last 30 days. Usually it is enough to see patterns, identify abnormalities and keep the situation under control.
If you want to see the dynamics of metrics for another period, use the filter by date.
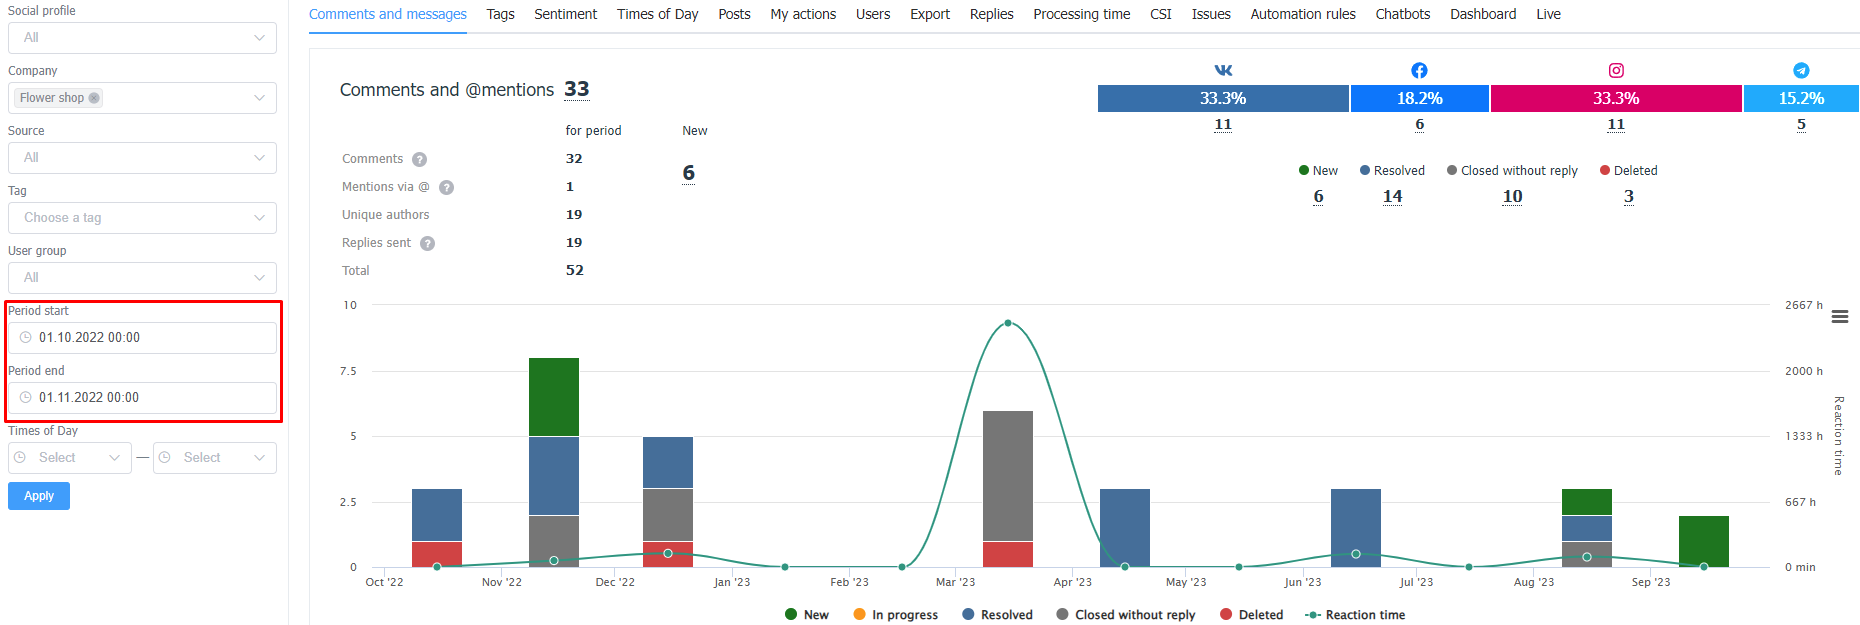
You can choose any period from 1 minute to 1 year. The chart step will be determined automatically based on the length of the period.