My actions
In theMy Actionsstatistics tab, you can view data about the current (logged in) user. The information is collected based on the actions performed while handling the content. By default, data is displayed for the last 30 days.
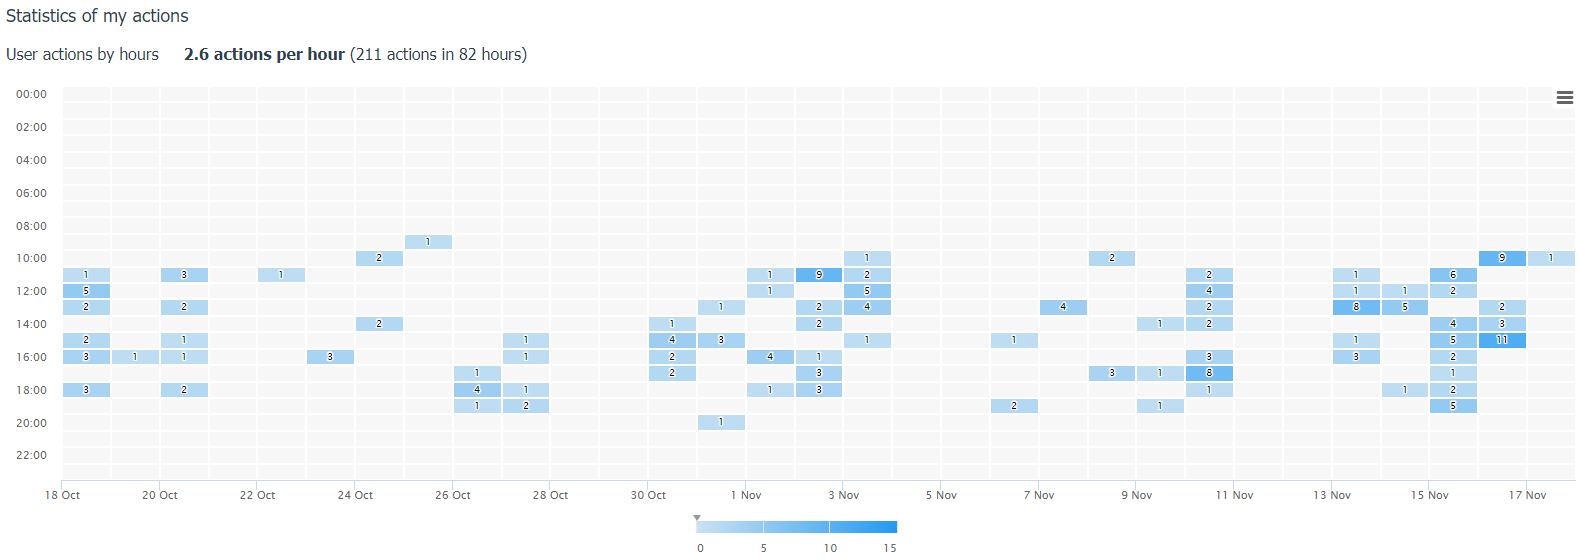
A graph of the user's actions by hour is available.
Please note that this graph only appears if you have selected a time period grouped by day.
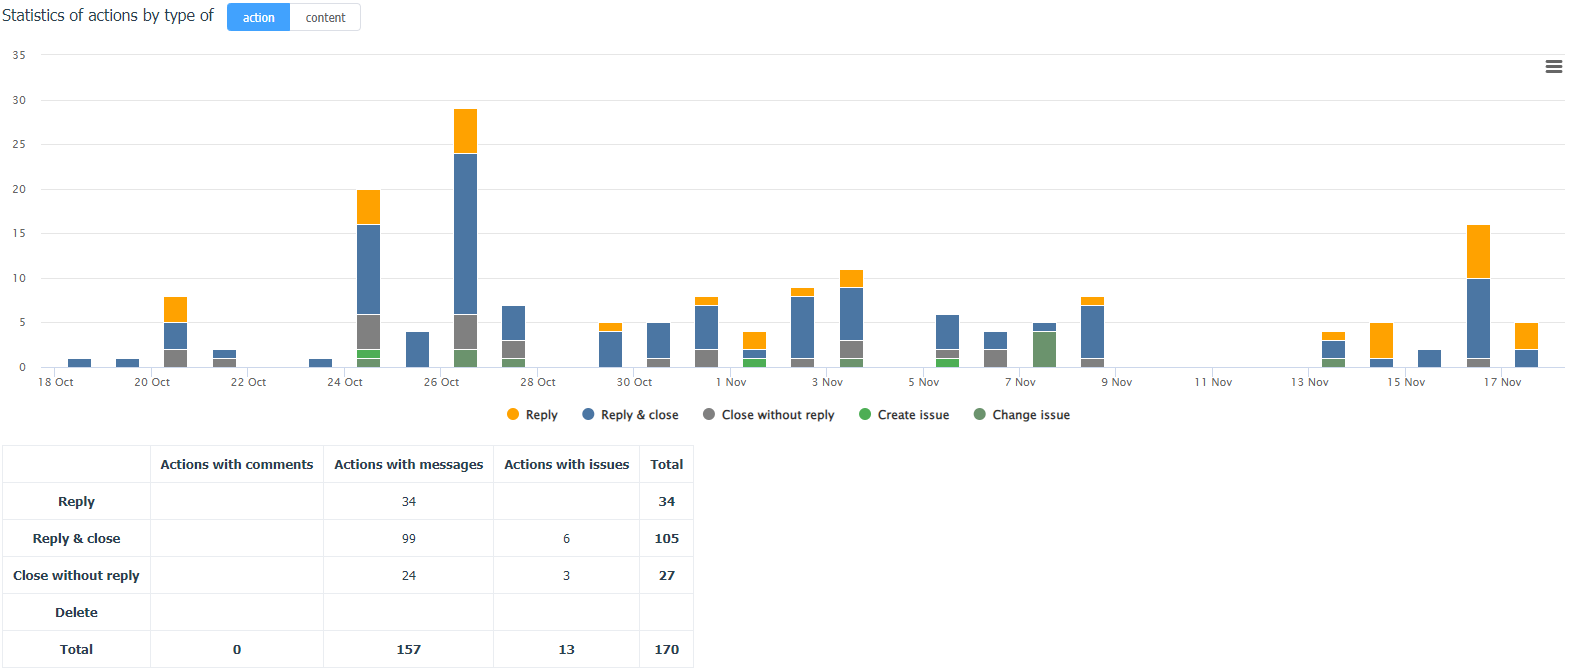
As well as a general graph of user actions bytype of action(Reply/Reply and close/Close without Reply/Delete) orhandled content(Actions with messages/Actions with comments/Actions with issues).
Below the chart bar is a summary table with a breakdown by type of mentions (comments and direct mentions/direct messages/issues).
Both chart bars can be downloaded as a graphic image in different extensions, or uploaded in table format.