Statistics on issues
If you use the issues feature in Angry.Space, statistics on their handling will be collected in this tab.
You can track on the graph how many new issues have been created during the period and in the last 24 hours, how many tasks are still pending, and how many are overdue. More detailed information on open issues for the period is shown in the summary table: how many tasks are waiting for handling, how many are in work, how many of them are overdue and for how long.
The figures in the summary table are clickable, so you can easily navigate to the necessary issues to view them in more detail.
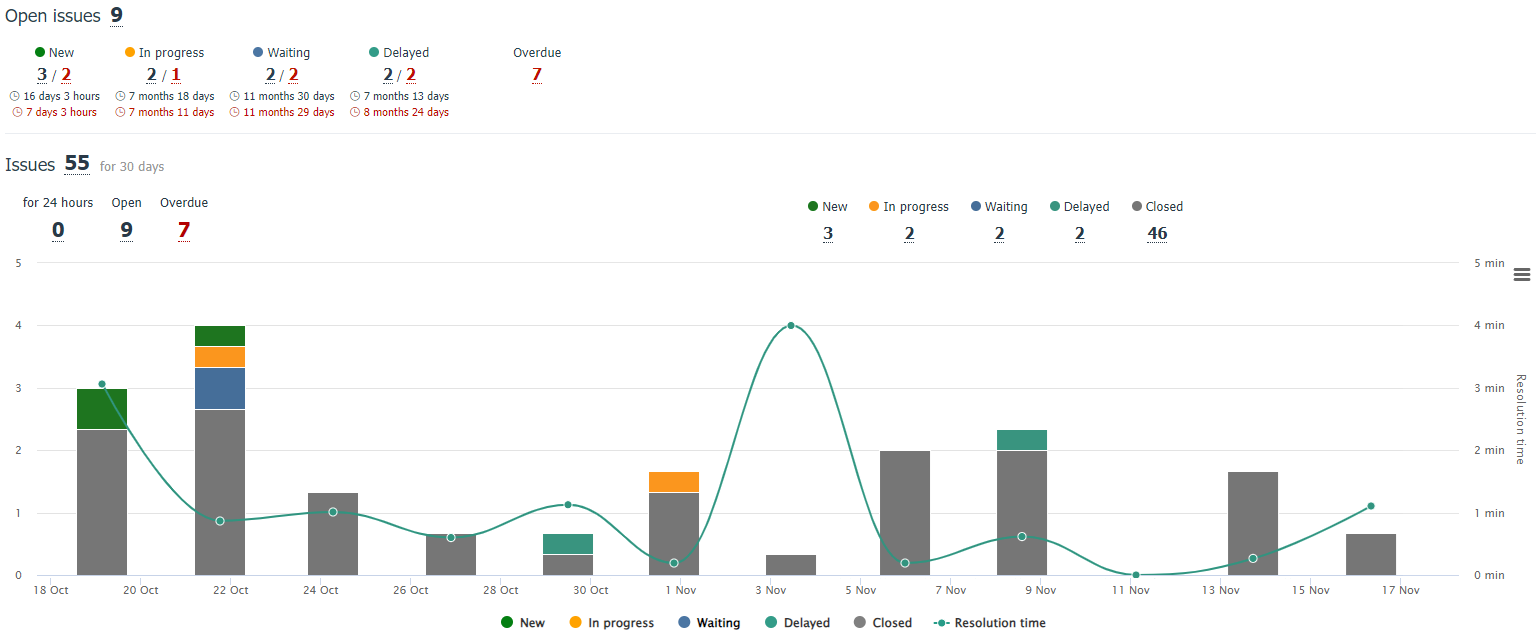
Use the table below the graph to estimate the average issue-solving time.
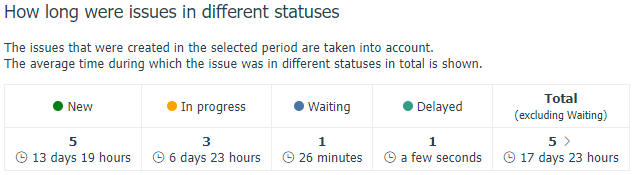
You can see how many issues and for how long were in different statuses (an issue will be accounted in a certain status after its change).
This table includes only the issuescreatedduring the selected time period.
The action statistics for users are available in the last table.
It accounts for all issues in which the user made an action in a selected period of time.
Some figures in the table are clickable, so you can go to the issues feed created by the selected user, or to theAction Logand view all actions of the selected user with issues for the selected period.
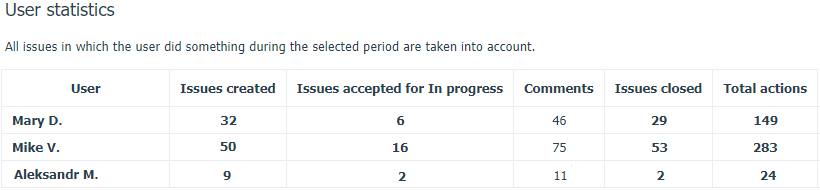
The table details how many issues for the selected period were created by each user, how many were put to work, the number of comments left, and how many issues were closed.
The table data can be exported to CSV for self-analysis.
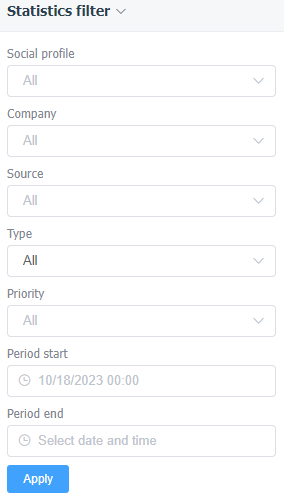
Use the filter field on the left to change the period, sort issues that are only related to direct messages/comments or were created manually, select issues with specific tags, etc.