Breakdown by time of day and day of the week
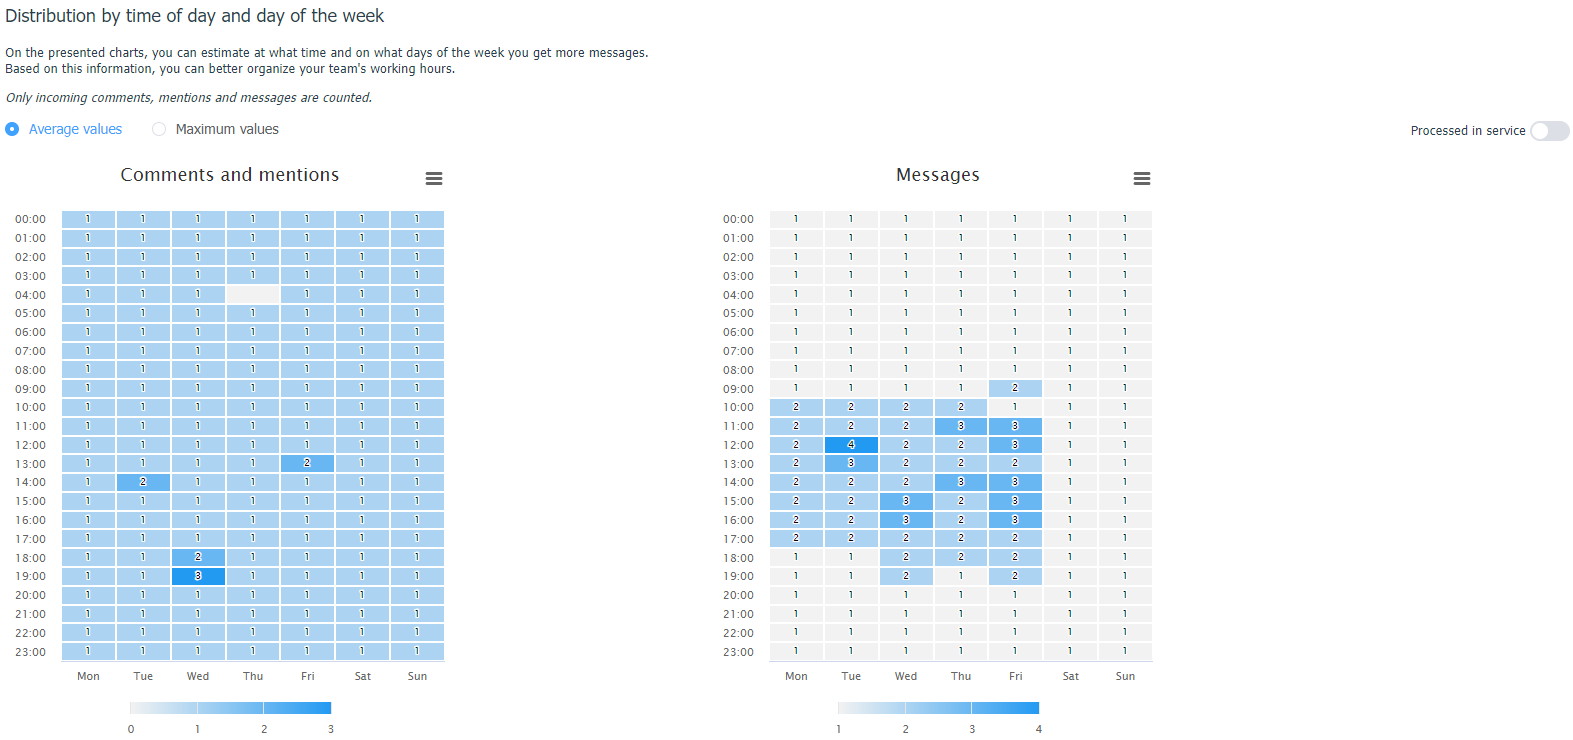
In the "Times of Day" tab, you can assess which times of day and days of the week your audience is more active. This could help to better manage the operators' work in order to, for example, reduce pending response time during peak hours.
The data is presented as an infographic broken down by content type: comments+mentions and direct messages.
Please note that only inbound content is taken into account when graphing.

If you have configured integration with one of the externalsocial listeningsystems, the activity of the audience in mentions will also be taken into account in this statistics tab as a separate graph.
You can also choose whether you want average or maximum period values.
By default the last 30 days are displayed, for analysis we recommend choosing a period of 3 months and looking at both the average and maximum to see what the actual peak loads are and how much they exceed the average load.
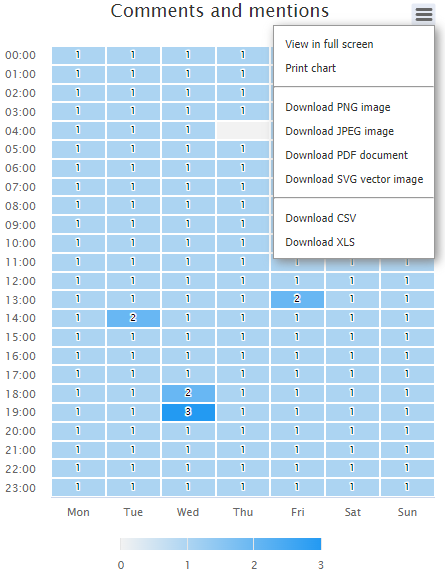
The charts presented can be downloaded as a graphic in different extensions, or uploaded in table format.
