Dashboard
Dashboard is a tool for visualizing and analyzing key performance indicators. In real time, it collects 24 hours of social profile statistics (+comparison with the previous 24 hours), and displays how many comments/messages are waiting to be handled, and how long the oldest one has been waiting.
To evaluate key performance indicators, go to theStatistics - Dashboard section
In this tab you can filter the data to be shown by the following parameters:
- social profile
- company (social profiles group)
- source (all social profiles of the same social network)
If more than one company is selected, you will see a list ofcompanynames with the number ofsocial profilesin each company (click on this link to expand the list of social profiles).
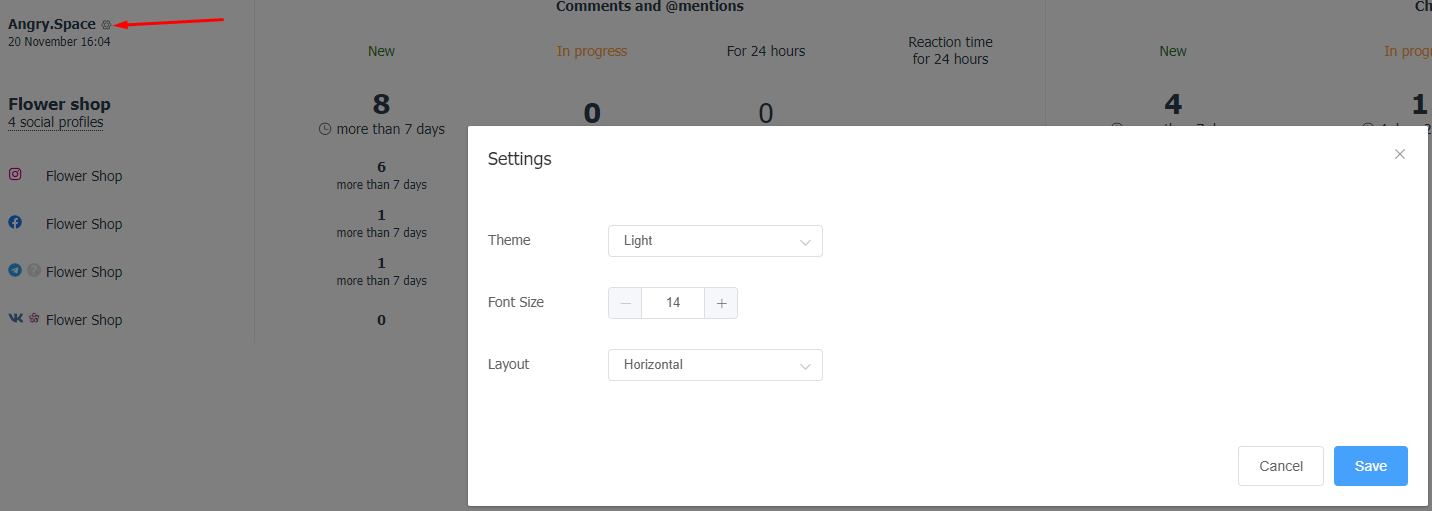
The icon in the upper left corner allows you to open the dashboard in a separate browser tab. This is useful, for example, for demonstrating real-time handling data.
In this tab, you can select a theme (dark, light), change the font size and also change the location of data in a table.
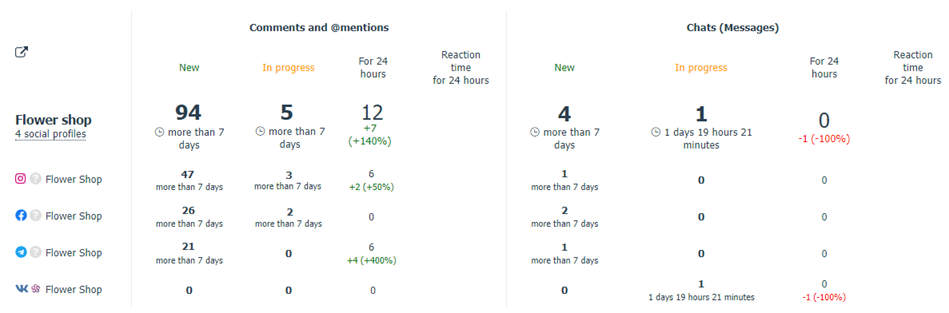
For convenience, the data is separated for comments/mentions and dialogs (direct messages).
- New - number of comments/dialogs in the status New. The number below it indicates how long the oldest one is waiting to be handled.
- In progress - number of comments/dialogs in the status In progress. The number below it, similarly, indicates how long the oldest of them is waiting to be handled.
- For 24 hours - the number of comments/dialogs received in the last 24 hours. At the bottom is a comparison with the previous 24 hours (quantitative (+ or -) and in percentages).
- Reaction time for 24 hours is the arithmetic mean of the first reaction time over the last 24 hours.
All figures in the table are clickable and open a feed of relevant comments/dialogs in Angry Space.